
Lenkie bills dashboard showing the credit facility balance and invoices

Product design · 2025

Designing for intent:84% increase in completed payment rate

Lenkie Technologies

My role:Lead Designer

Project overview

The project at a glance.

Company context

Lenkie helps UK businesses access credit and manage bills. Customers were passing through the dashboard to reach the work they needed to do.

The solution

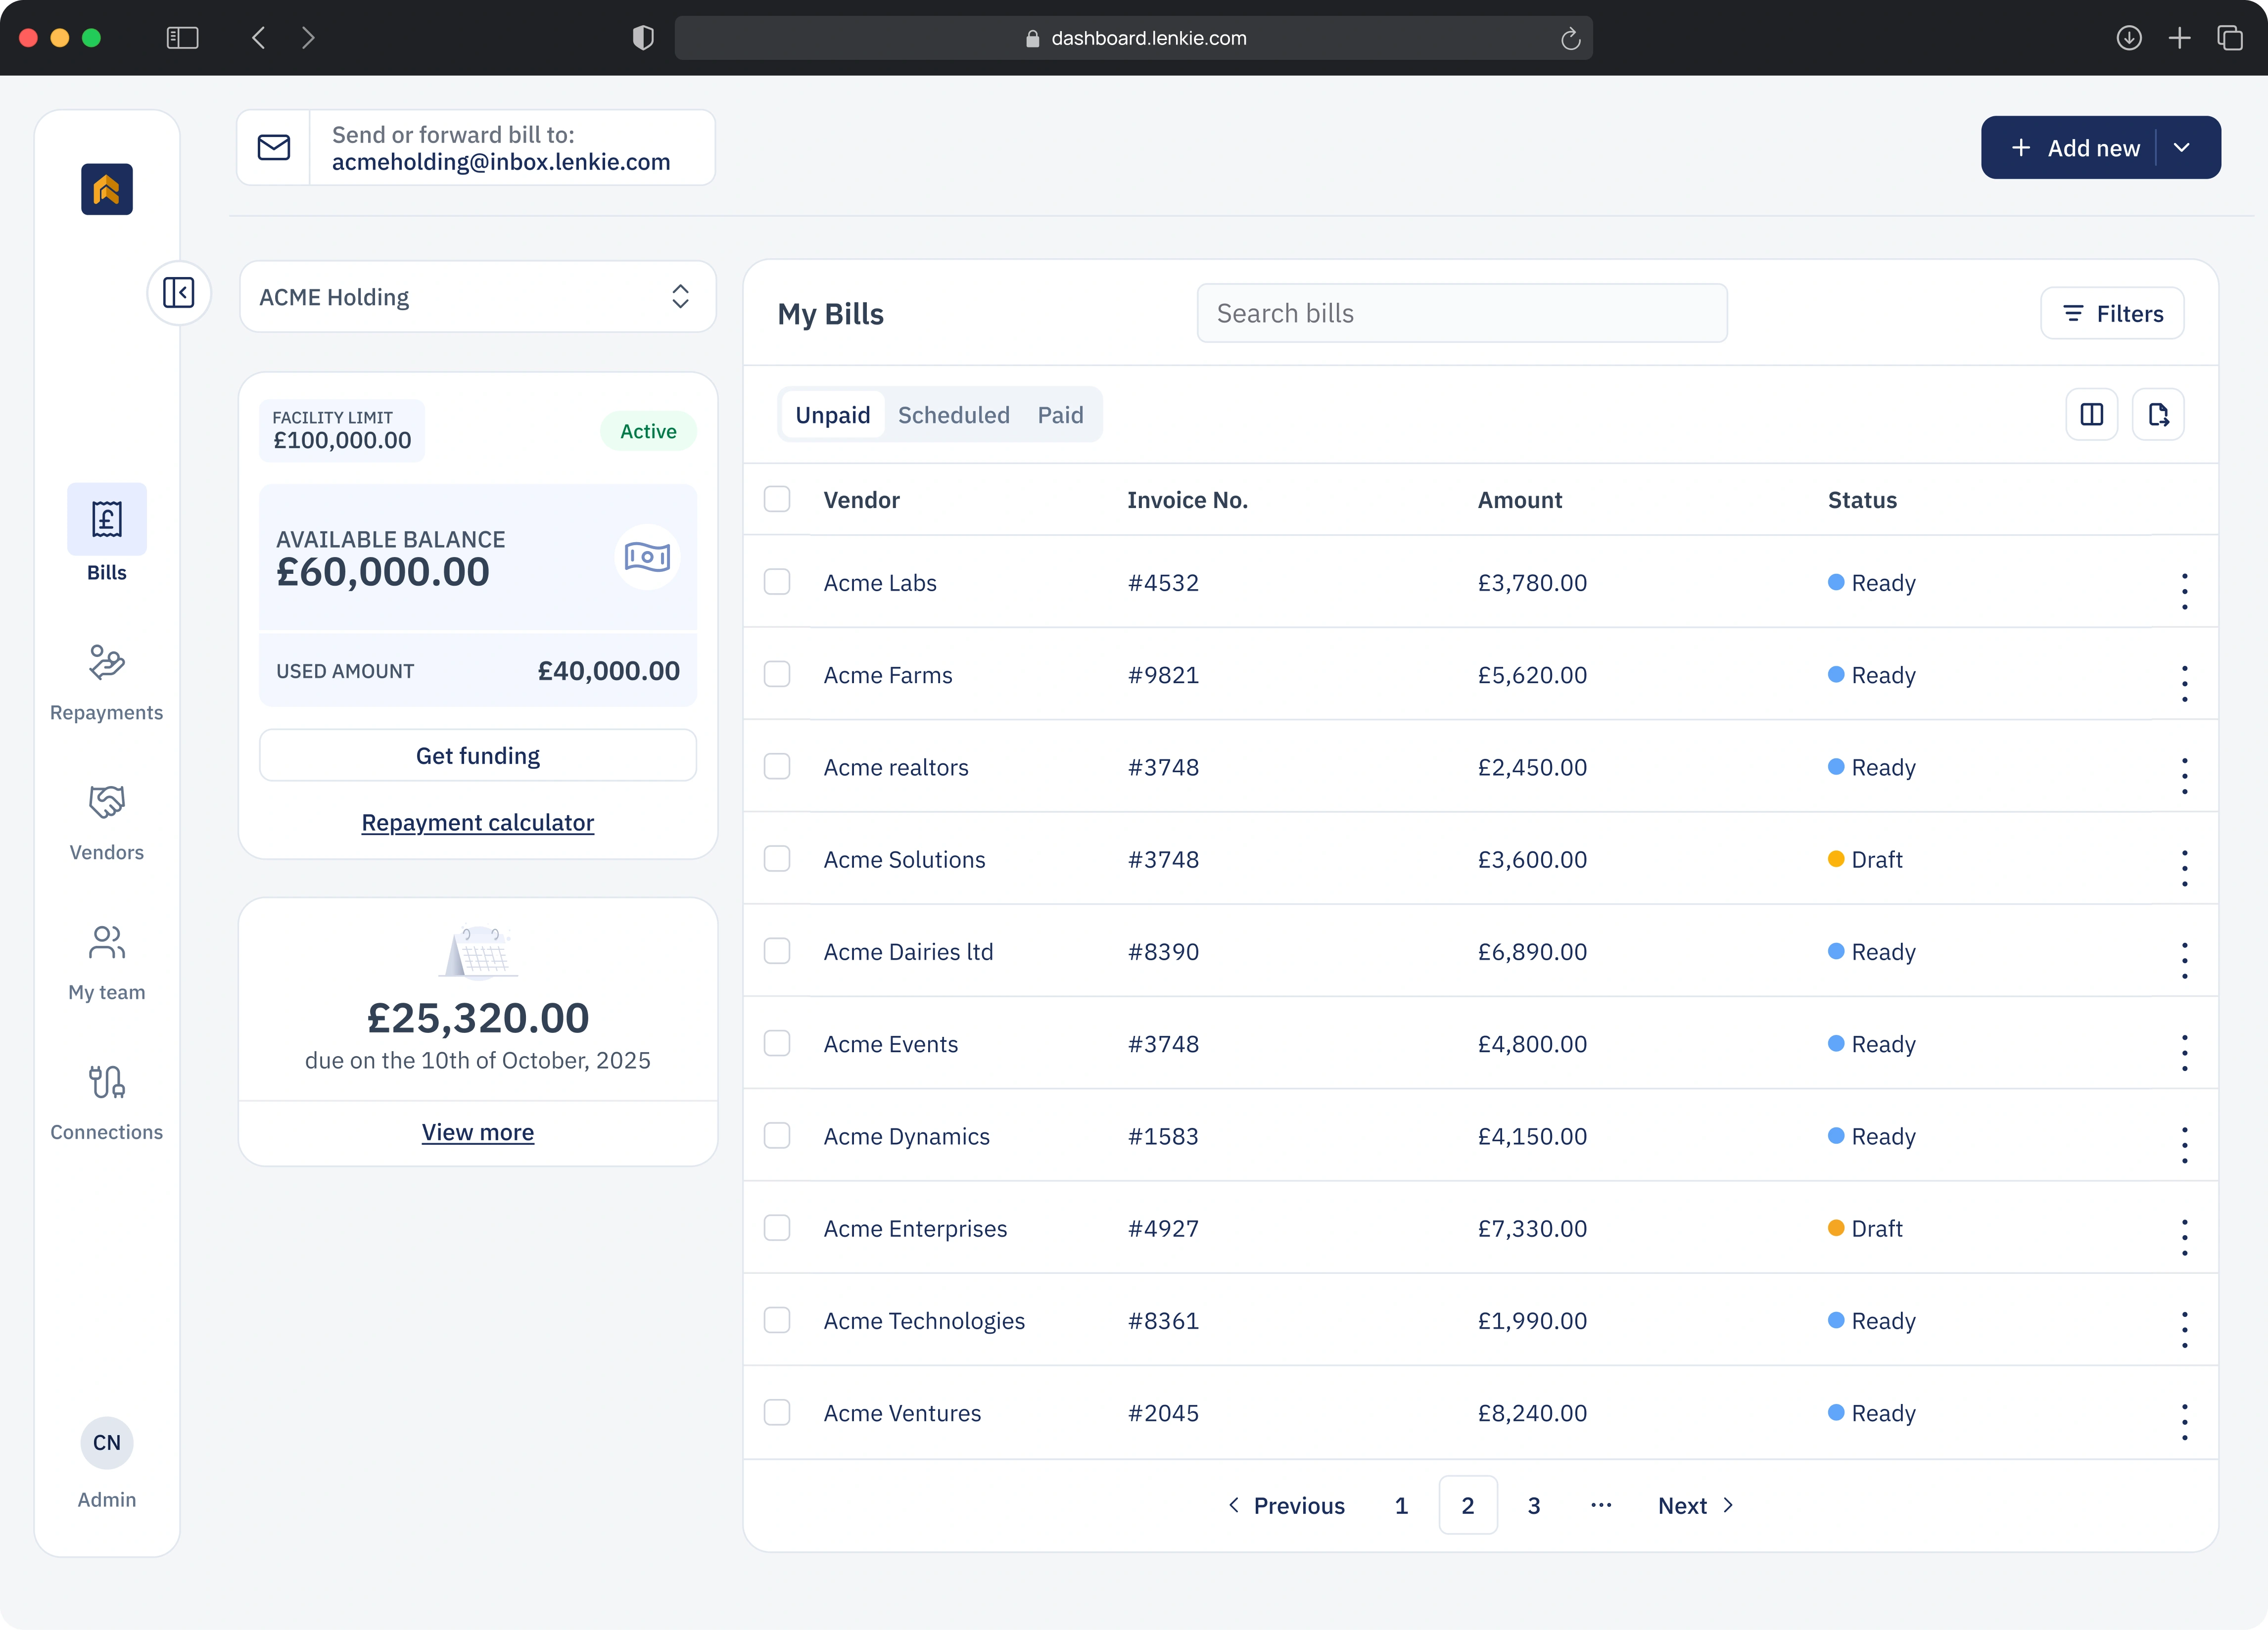
I initiated the investigation and led a task-first redesign, bringing bills, payment actions and a compact credit summary into one workspace.
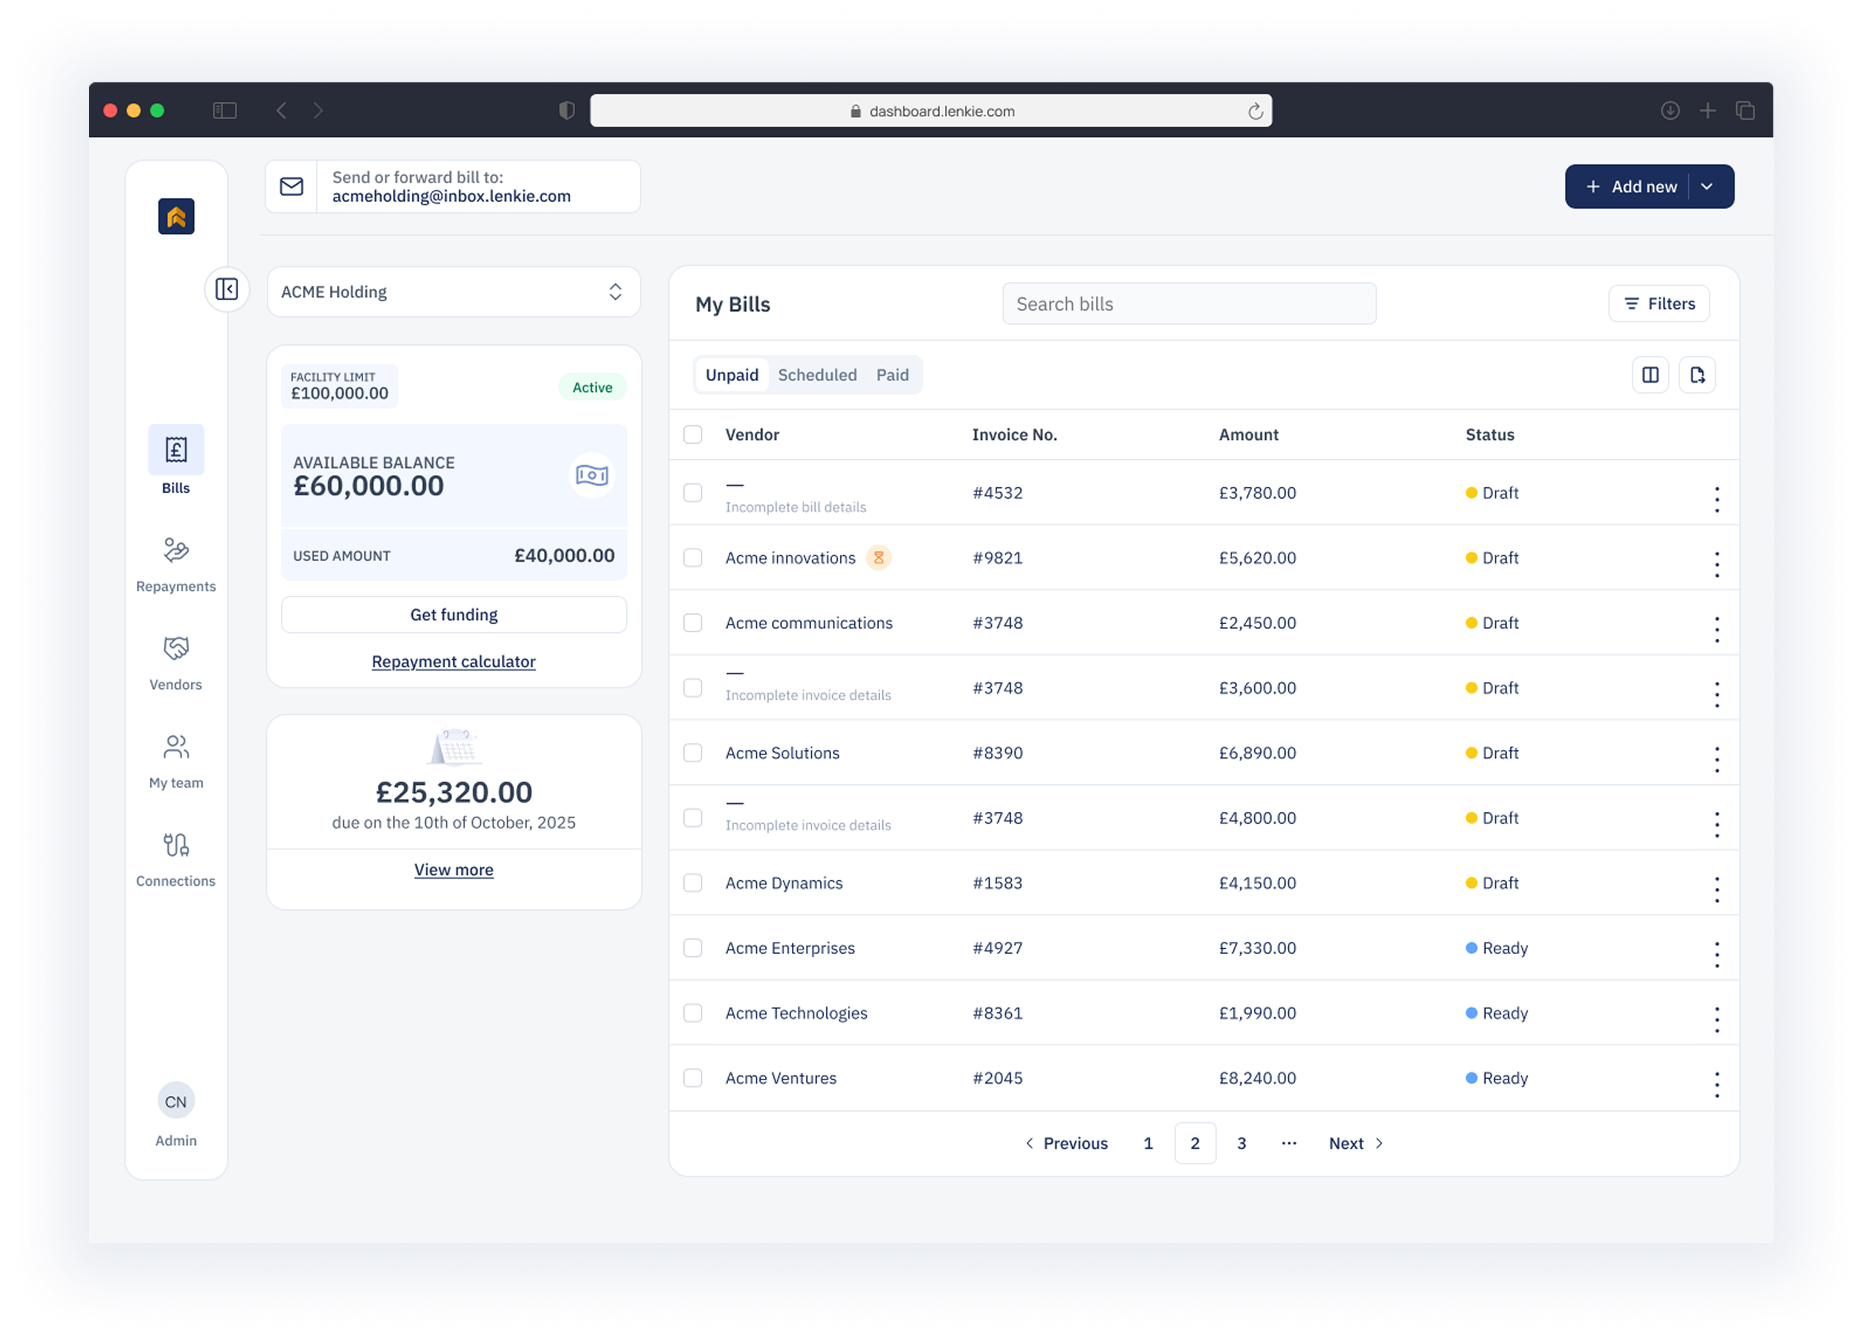
Lenkie bills dashboard showing the credit facility balance and invoices
The redesigned bills workspace.
Completed payment rate+84%
Engagement56% → 83%

Up 27 percentage points

Bounce rate44% → 17%

Payment completion: launch baseline vs six weeks later. Engagement and bounce rate: four weeks.
01 | Context

Customers came to pay bills.

The dashboard looked healthy in the headline metrics. Watching how people used it told a different story.

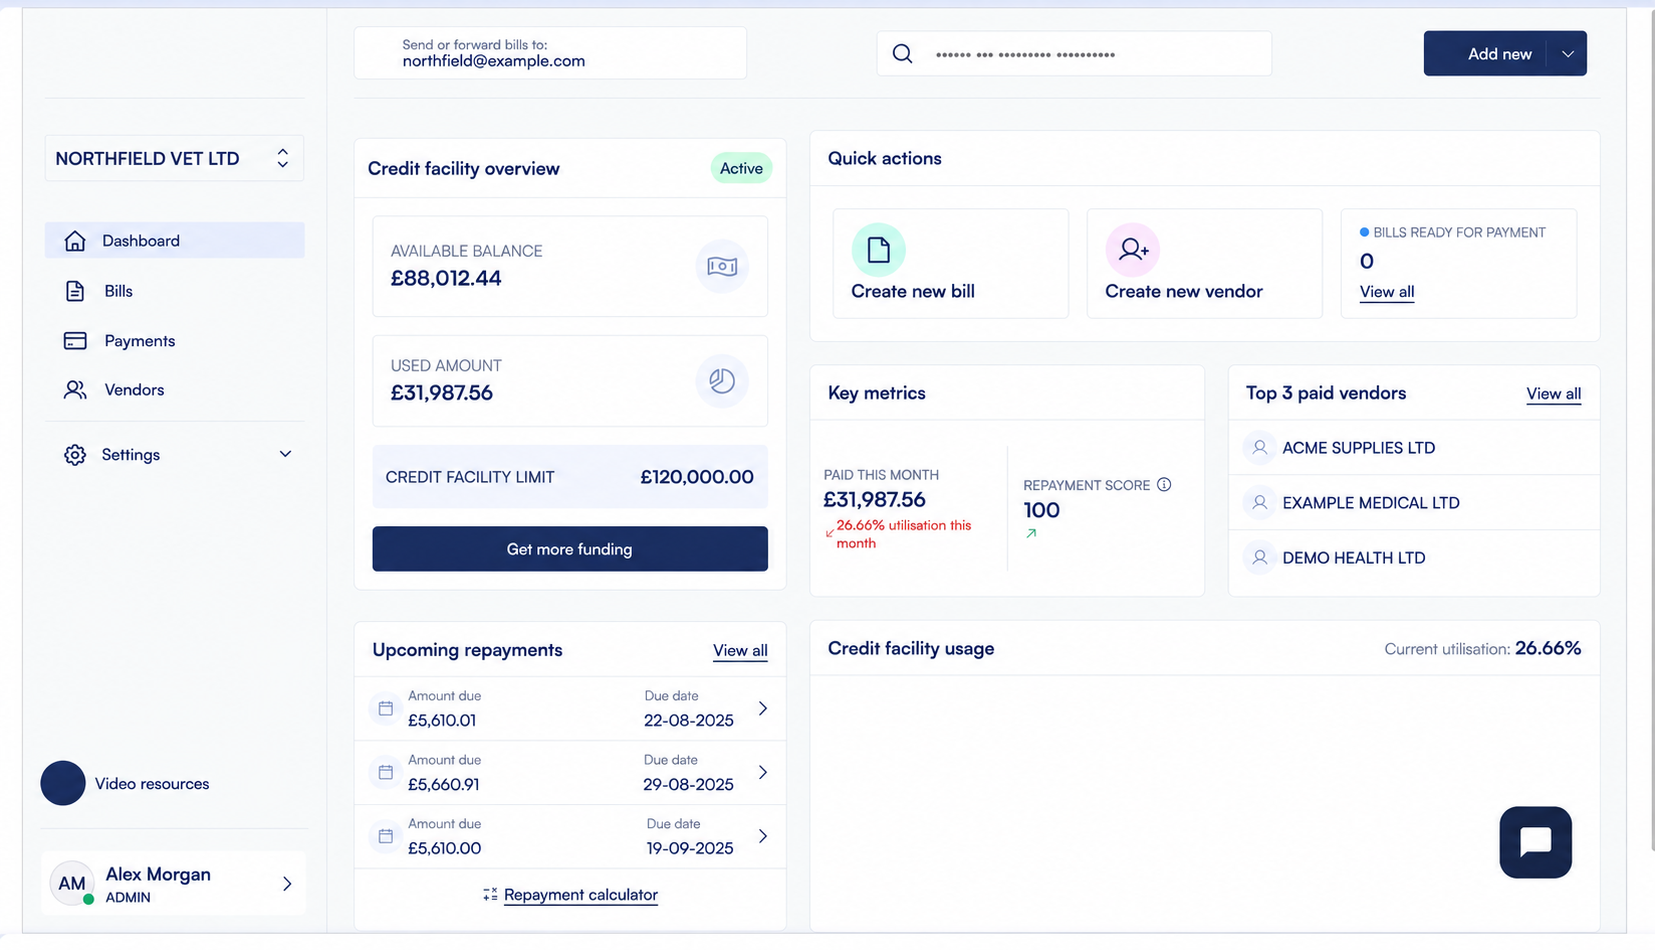
Original Lenkie dashboard showing quick actions and a credit utilisation graph
The original dashboard put the financial overview first.
The first 10 seconds78%

bypassed quick actions and went straight to the bills table.

The dashboard was a stop on the way to their task. I wanted to understand why.

02 | Discovery

The same journey kept appearing.

I reviewed 120 days of data: navigation patterns, heat maps and session recordings.

01 / Navigation patterns
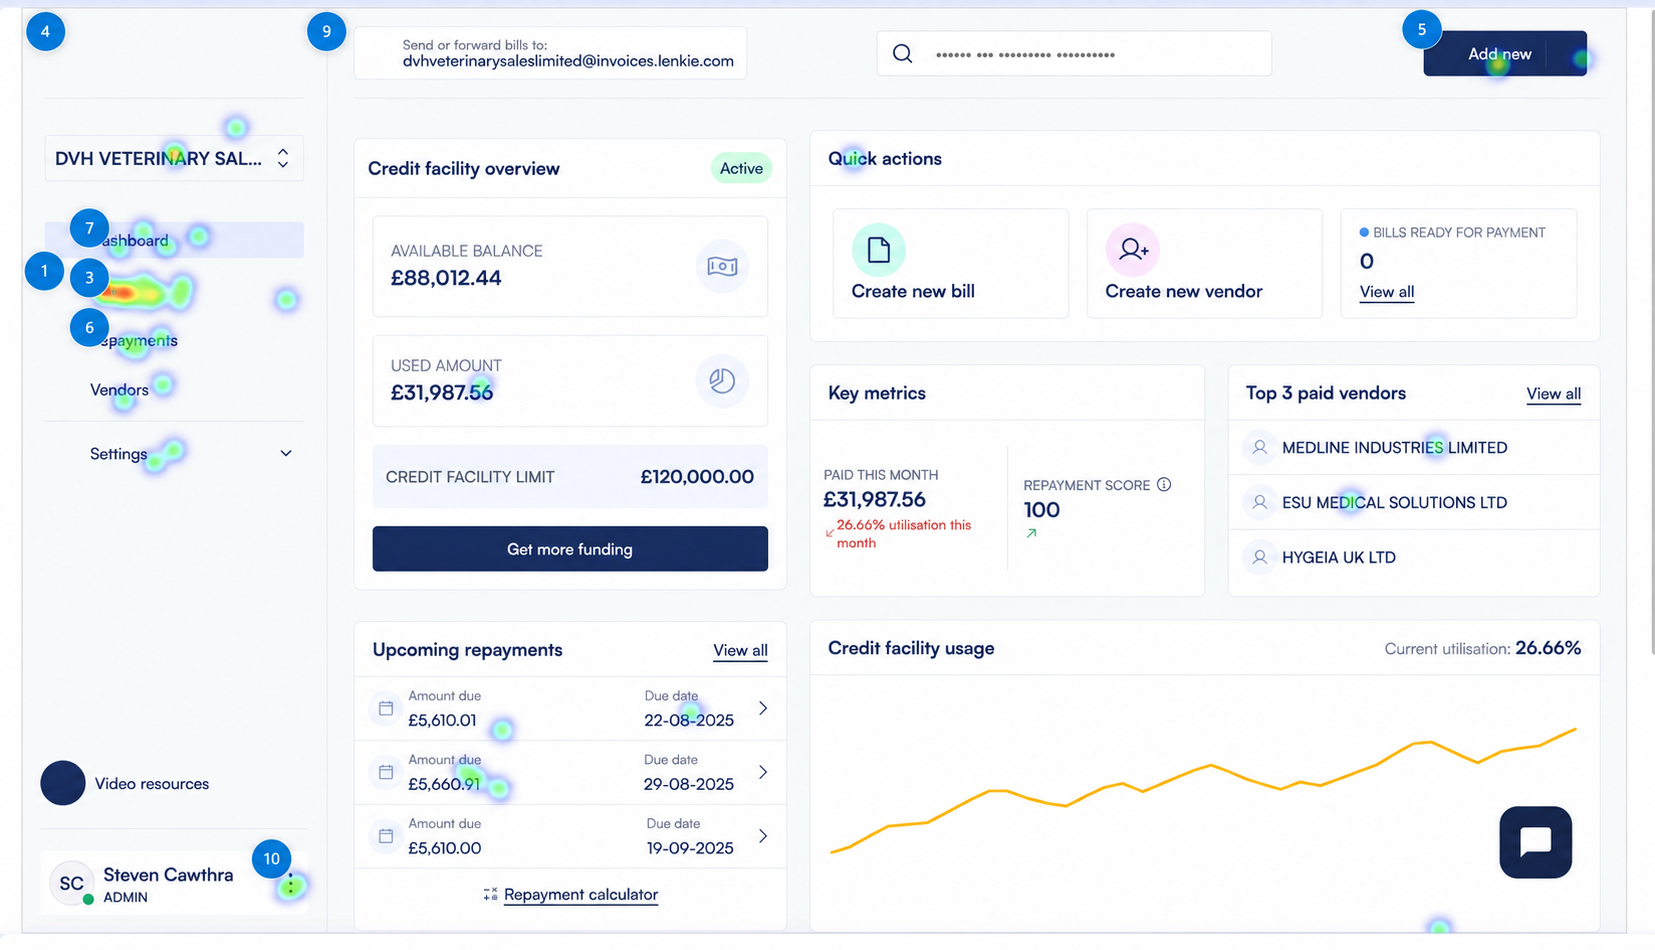
Full Lenkie dashboard heatmap, focusing on activity around Bills navigation

Straight to bills

Users bypassed quick actions and navigated to the bills table within their first 10 seconds.

02 / Attention mapping
Full Lenkie dashboard heatmap, focusing on the credit facility usage chart with a yellow graph line

Little attention here

The heat map showed little interaction with the facility utilisation graph despite its prominent position.

03 / Task intent
Full Lenkie dashboard heatmap, focusing on quick actions for bill payment

One repeated task

Session recordings repeatedly showed the same narrow bill-payment journey through the product.

We had organised the dashboard around financial overviews. Customers mainly needed to manage and pay bills.

03 | Research & direction

Put the work in the centre.

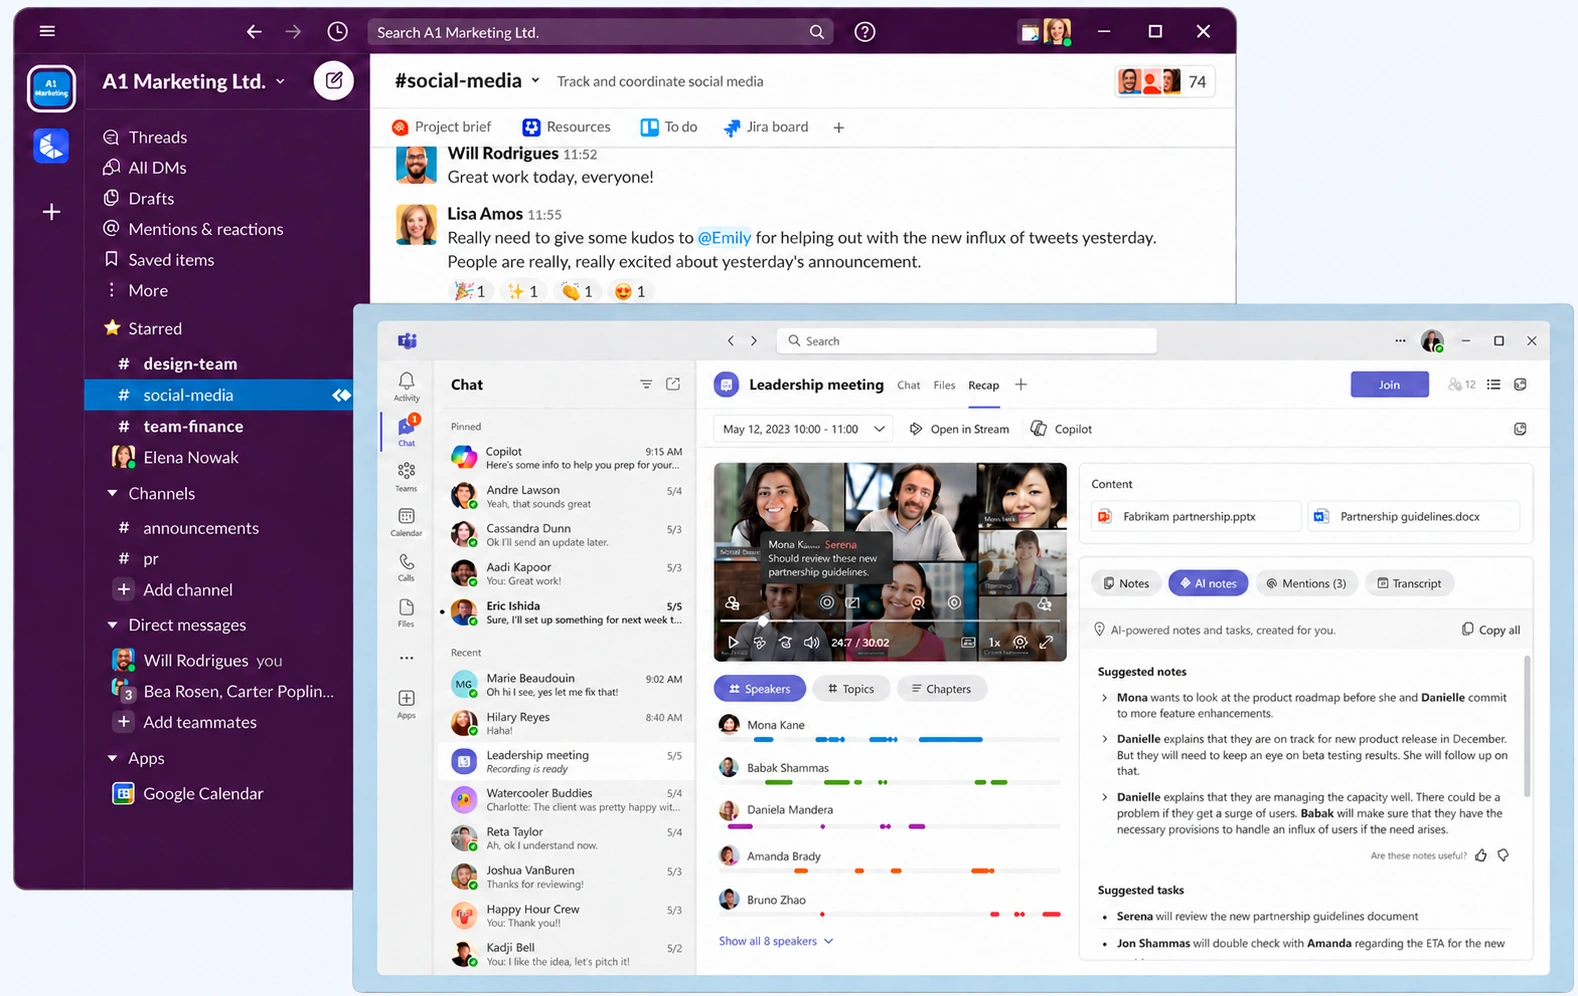
Slack and Microsoft Teams offered a useful starting point: the main task stays central, with supporting information close by.

Before

Overview first

Navigate again to reach bills.

Direction

Bills first

Keep the credit summary nearby.

Slack and Microsoft Teams interfaces used as workspace references
Reference products helped me frame the layout decision.
04 | Leadership

There was no brief for this.

I noticed the pattern during routine monitoring, investigated it and took the findings to senior management.

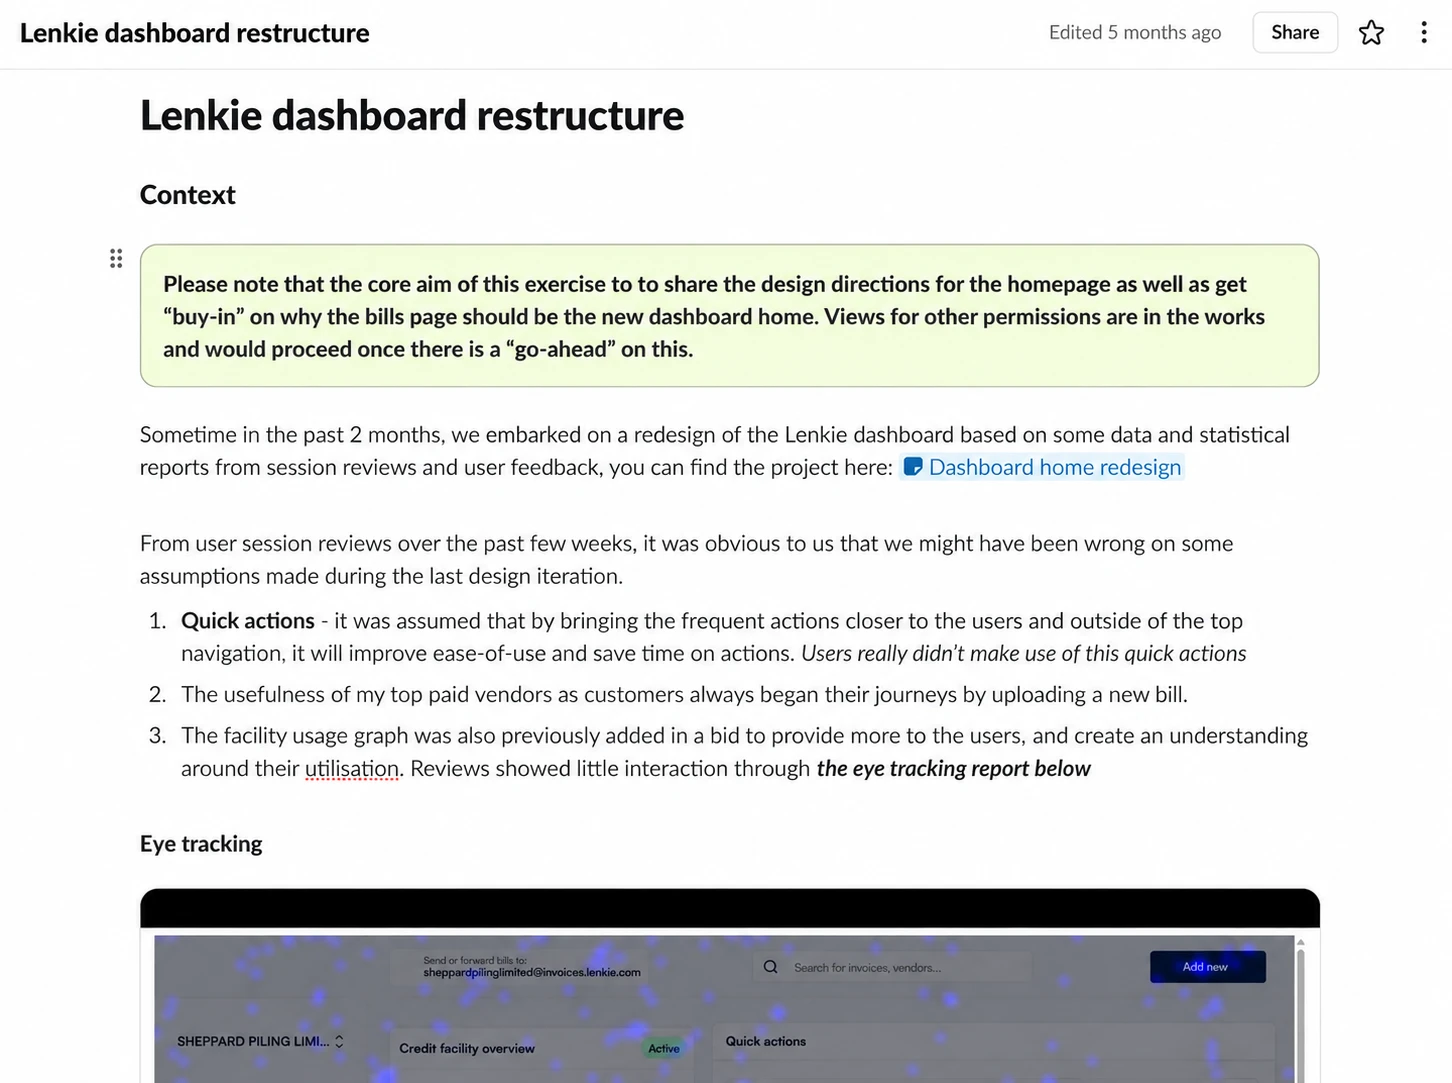
Dashboard restructure proposal explaining why bills should become the home workspace
The proposal connected customer behaviour to a concrete change.
  1. 01

    Show the behaviour.

    The 78% bypass rate made the problem tangible.

  2. 02

    Propose the change.

    Make bills the primary interface.

  3. 03

    Explain why it matters.

    Connect an easier bill-payment journey to engagement and payment completion.

05 | Working through pushback

Three concerns. A better plan.

The questions from Product, Finance and Engineering helped shape what we shipped—and how.

01 / Product

Keep reporting useful.

Izu and a Product colleague reviewing a bills workspace with a compact summary alongside a separate detailed report.

I revisited sessions by user type. Business owners bypassed the graph; account managers used an internal view. We kept the dashboard summary and moved the detail into a dedicated view.

02 / Finance

Agree a review gate.

Izu and a Finance colleague discussing a rollout board with one of four groups selected and a later review point still undecided.

I proposed launching to 25% of users, with success criteria agreed in advance. A four-week review gave us a basis for deciding on the full rollout.

03 / Engineering

Split the delivery.

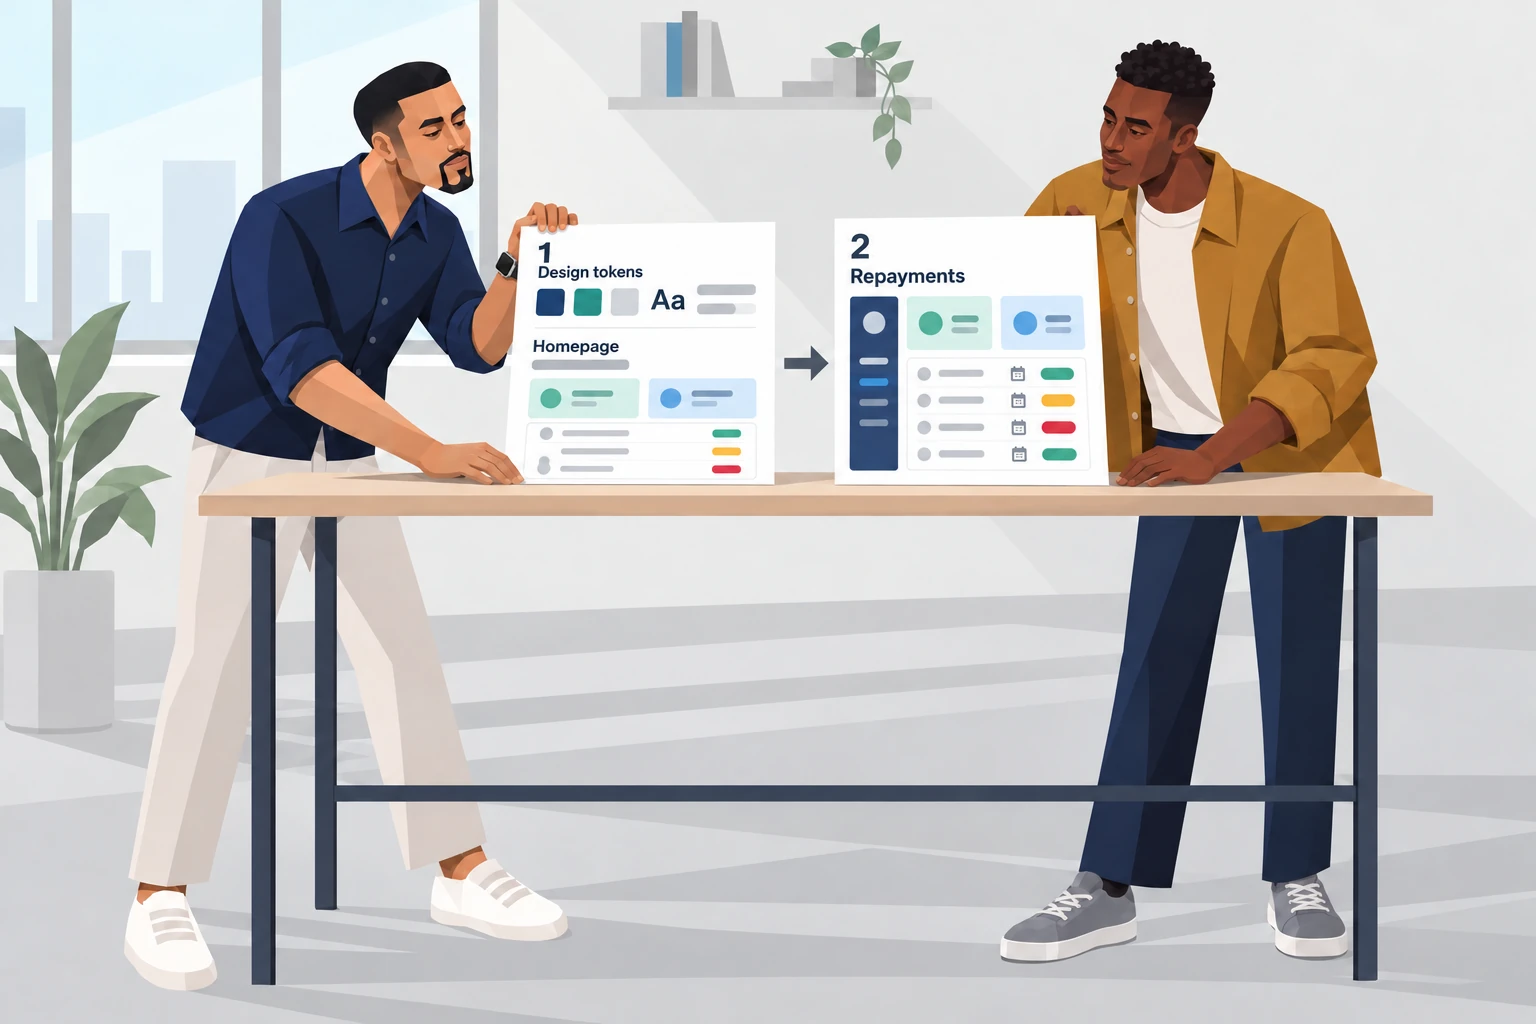
Izu and an Engineering colleague arranging two releases: updated design tokens and the new homepage first, followed by repayments.

We split the work into two releases. The updated design tokens and new homepage shipped first, followed by repayments.

06 | Collaboration & mentorship

We both designed. We both reviewed.

Remy Dike owned repayments. I designed the wider experience. We gave each other room to question the work.

One decision from our reviews

Urgency first. Action next.

One iteration combined status and due date to save space. I asked what customers needed to understand first.

Remy identified two decisions: assess urgency, then decide what to do. He separated the fields to support that sequence.

Those conversations went both ways. Remy reviewed my work and challenged my reasoning too.

Illustration of Izu and Remy reviewing a repayments dashboard in a light grey office. Remy points to separate status and due-date fields while Izu responds.
A shared review, with room to explain and challenge decisions.
07 | Design

Bring bills to the centre.

Explore each change: see the complete workspace, then zoom into the detail.

Task-first architecture

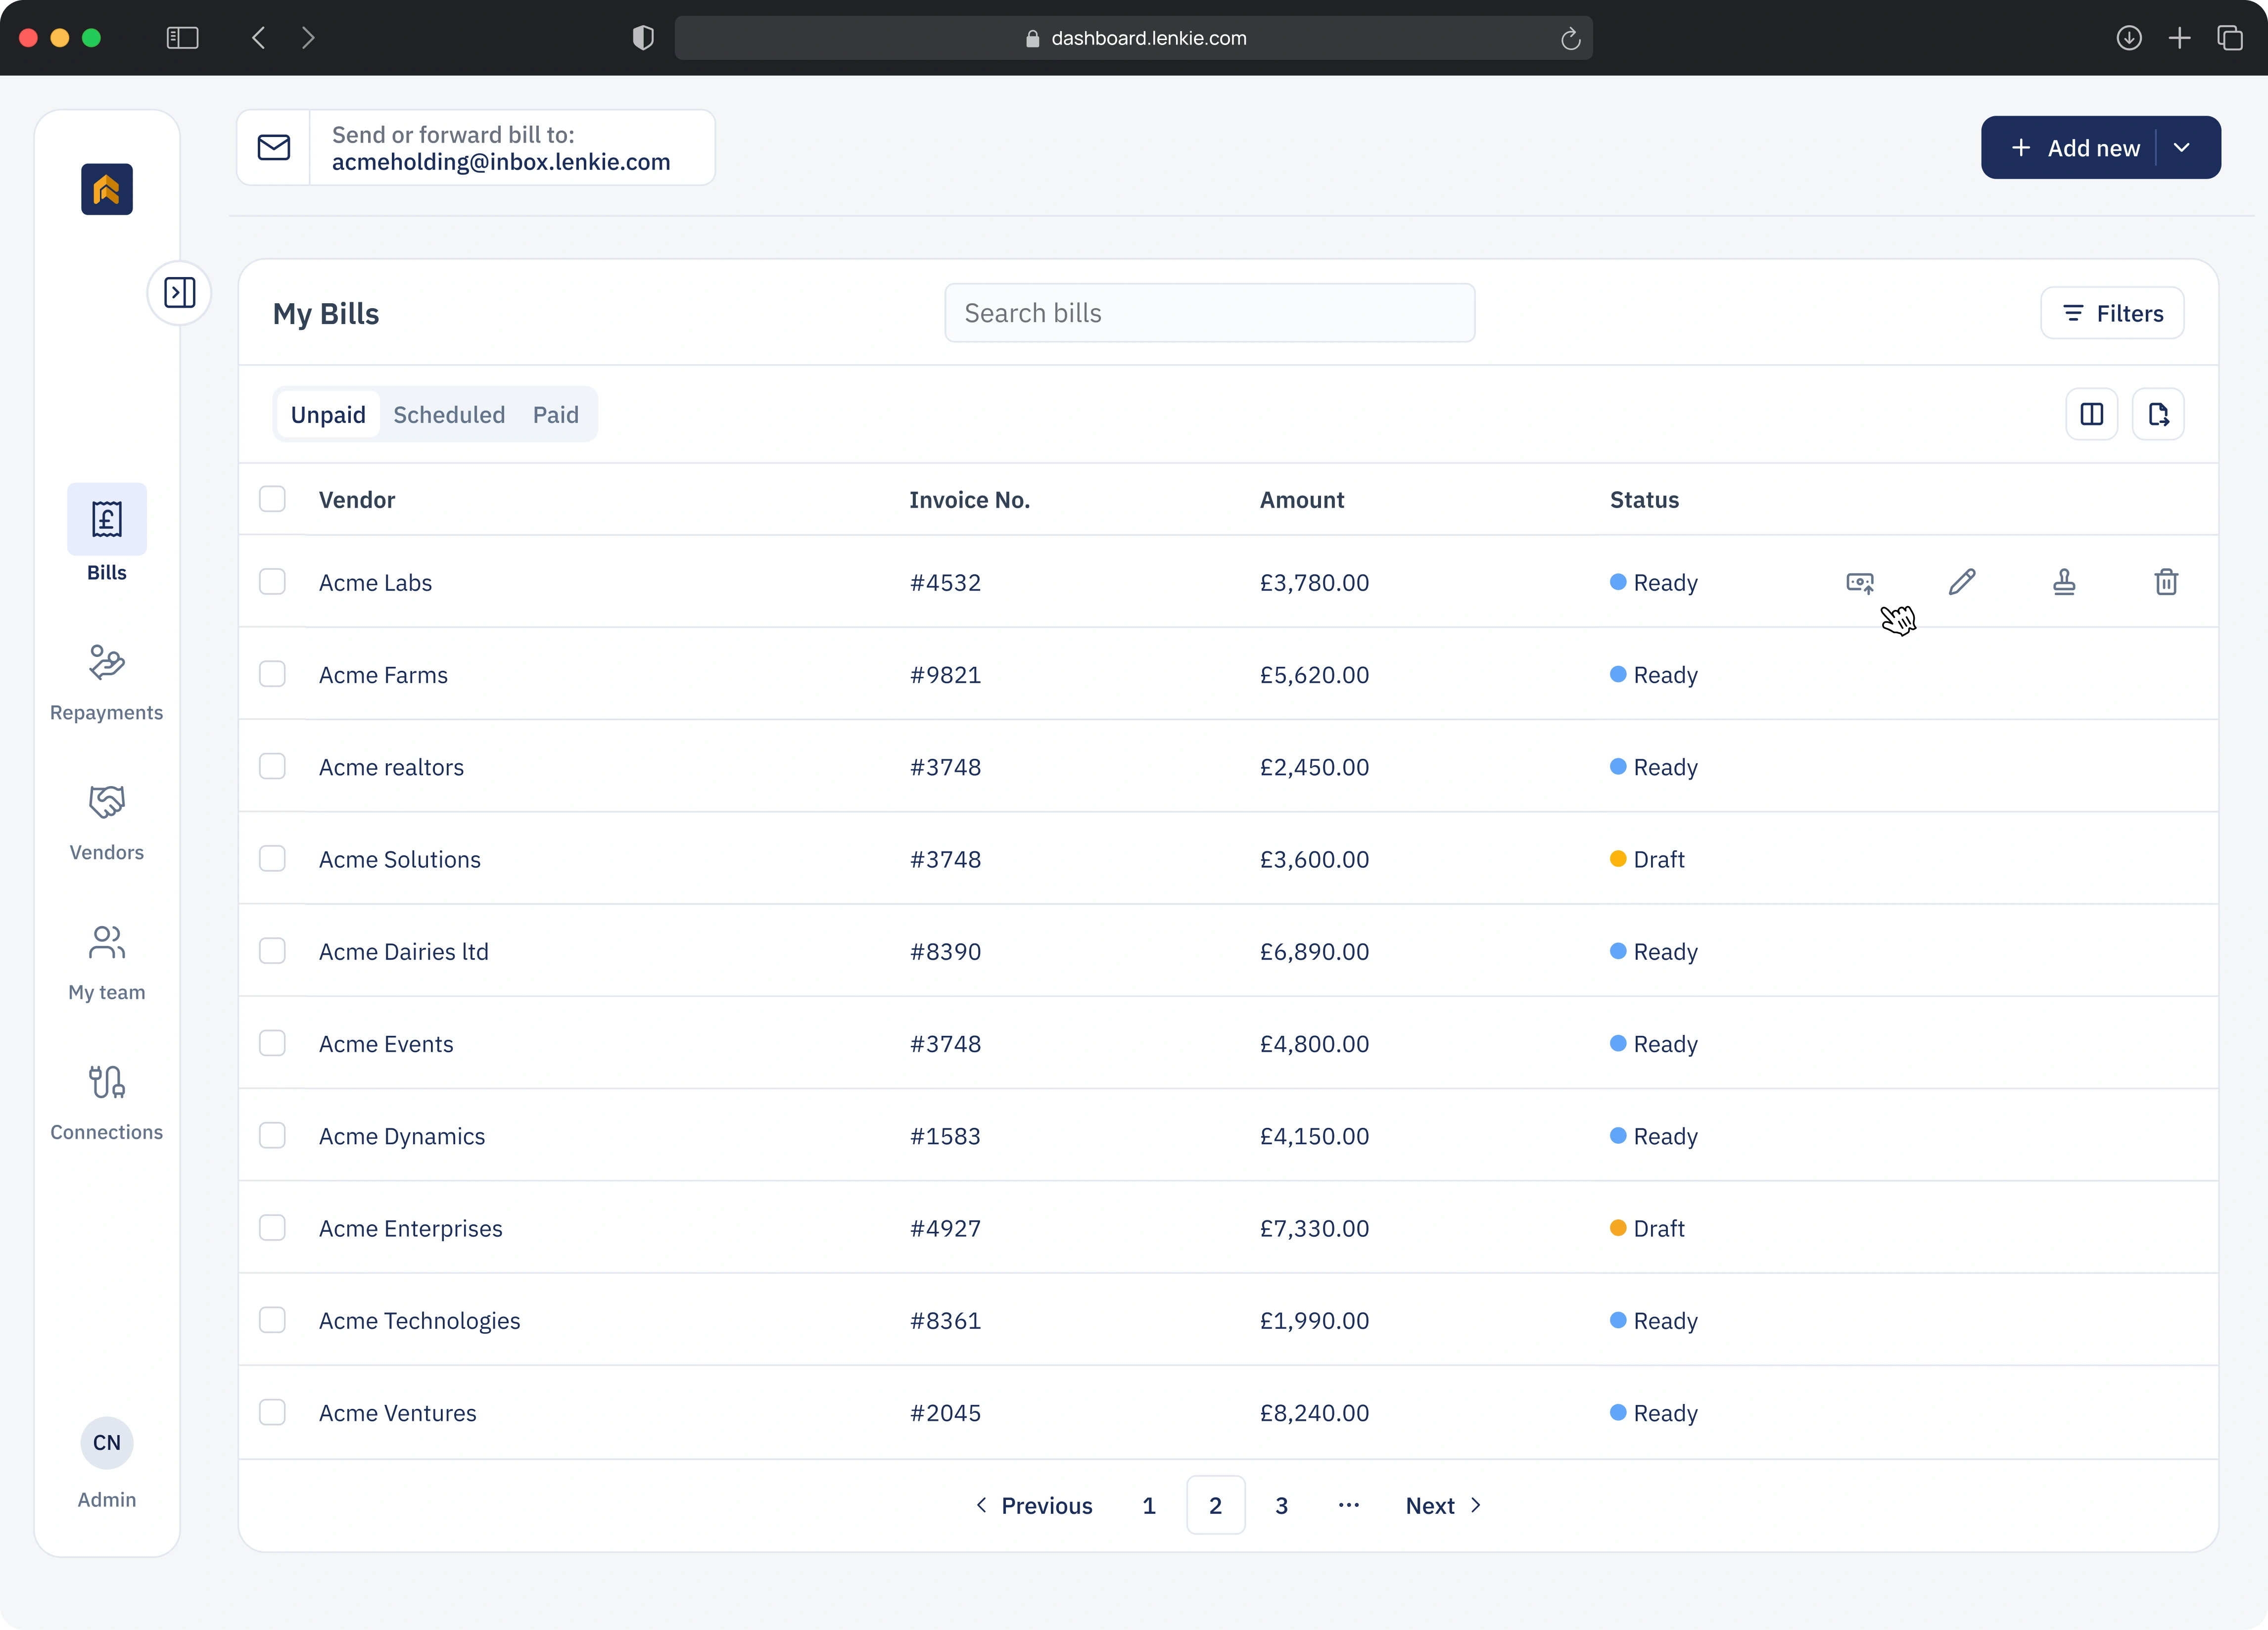
We moved the bills table onto the main dashboard so customers could reach it without navigating to another page.

The redesigned dashboard with My Bills as the primary workspace
08 | Repayments

See repayments across the month.

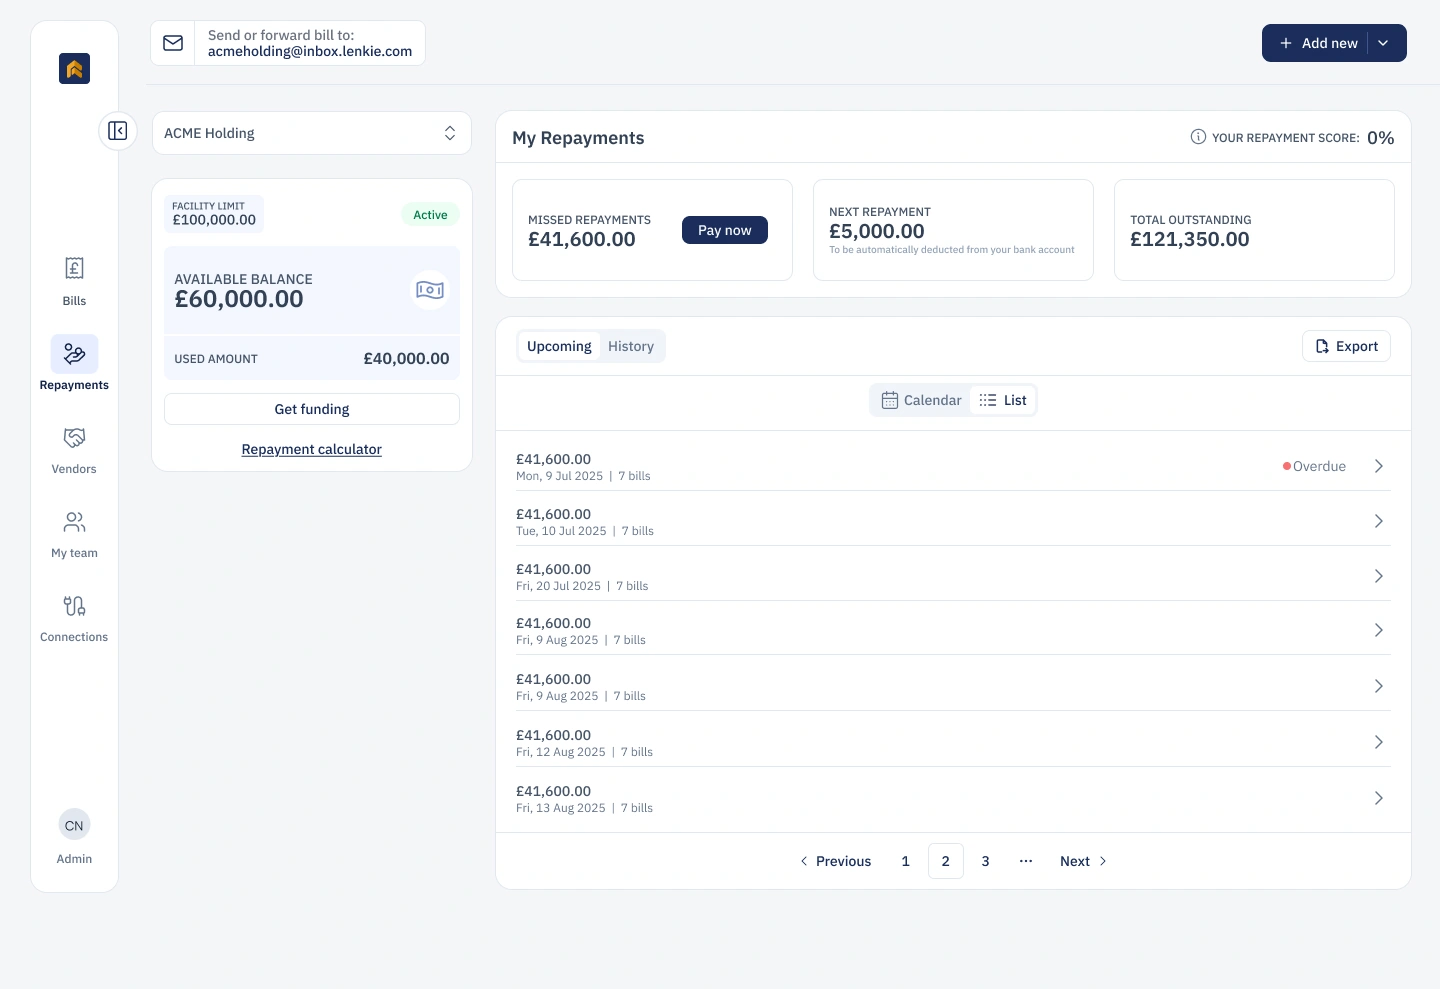
Users can review upcoming repayments as a list or see when payments fall on a calendar.

  1. 01

    Start with the list.

    Scan upcoming repayments and their status.

  2. 02

    Switch to calendar.

    See repayments across the month.

  3. 03

    Expand the calendar.

    Hide the credit panel to use the full workspace.

Repayments interface: choose Calendar instead of List, then hide the credit facility panel to expand the calendar across the workspace.
List viewList → calendar → full width
09 | Results after launch

After launch, behaviour changed.

Shortcuts into payment flows helped customers complete their payments.

Lower bounce rate61%

44% down to 17%

Higher engagement56% → 83%

Up 27 percentage points

Completed payment rate+84%

Launch baseline → six weeks later

Faster payment flow14%

Average completion time

The completed payment rate was 84% higher six weeks after launch than at launch.

10 | Reflection

10 | Reflection

Make room for better decisions.

Looking closely at customer behaviour revealed what the headline metrics had missed. Product helped me test the evidence, Finance helped shape the rollout, and Engineering helped us deliver in stages. Remy and I designed together and challenged each other’s decisions. I’d take that approach again: investigate what feels off, share what I find and give colleagues room to improve the work.

Up next

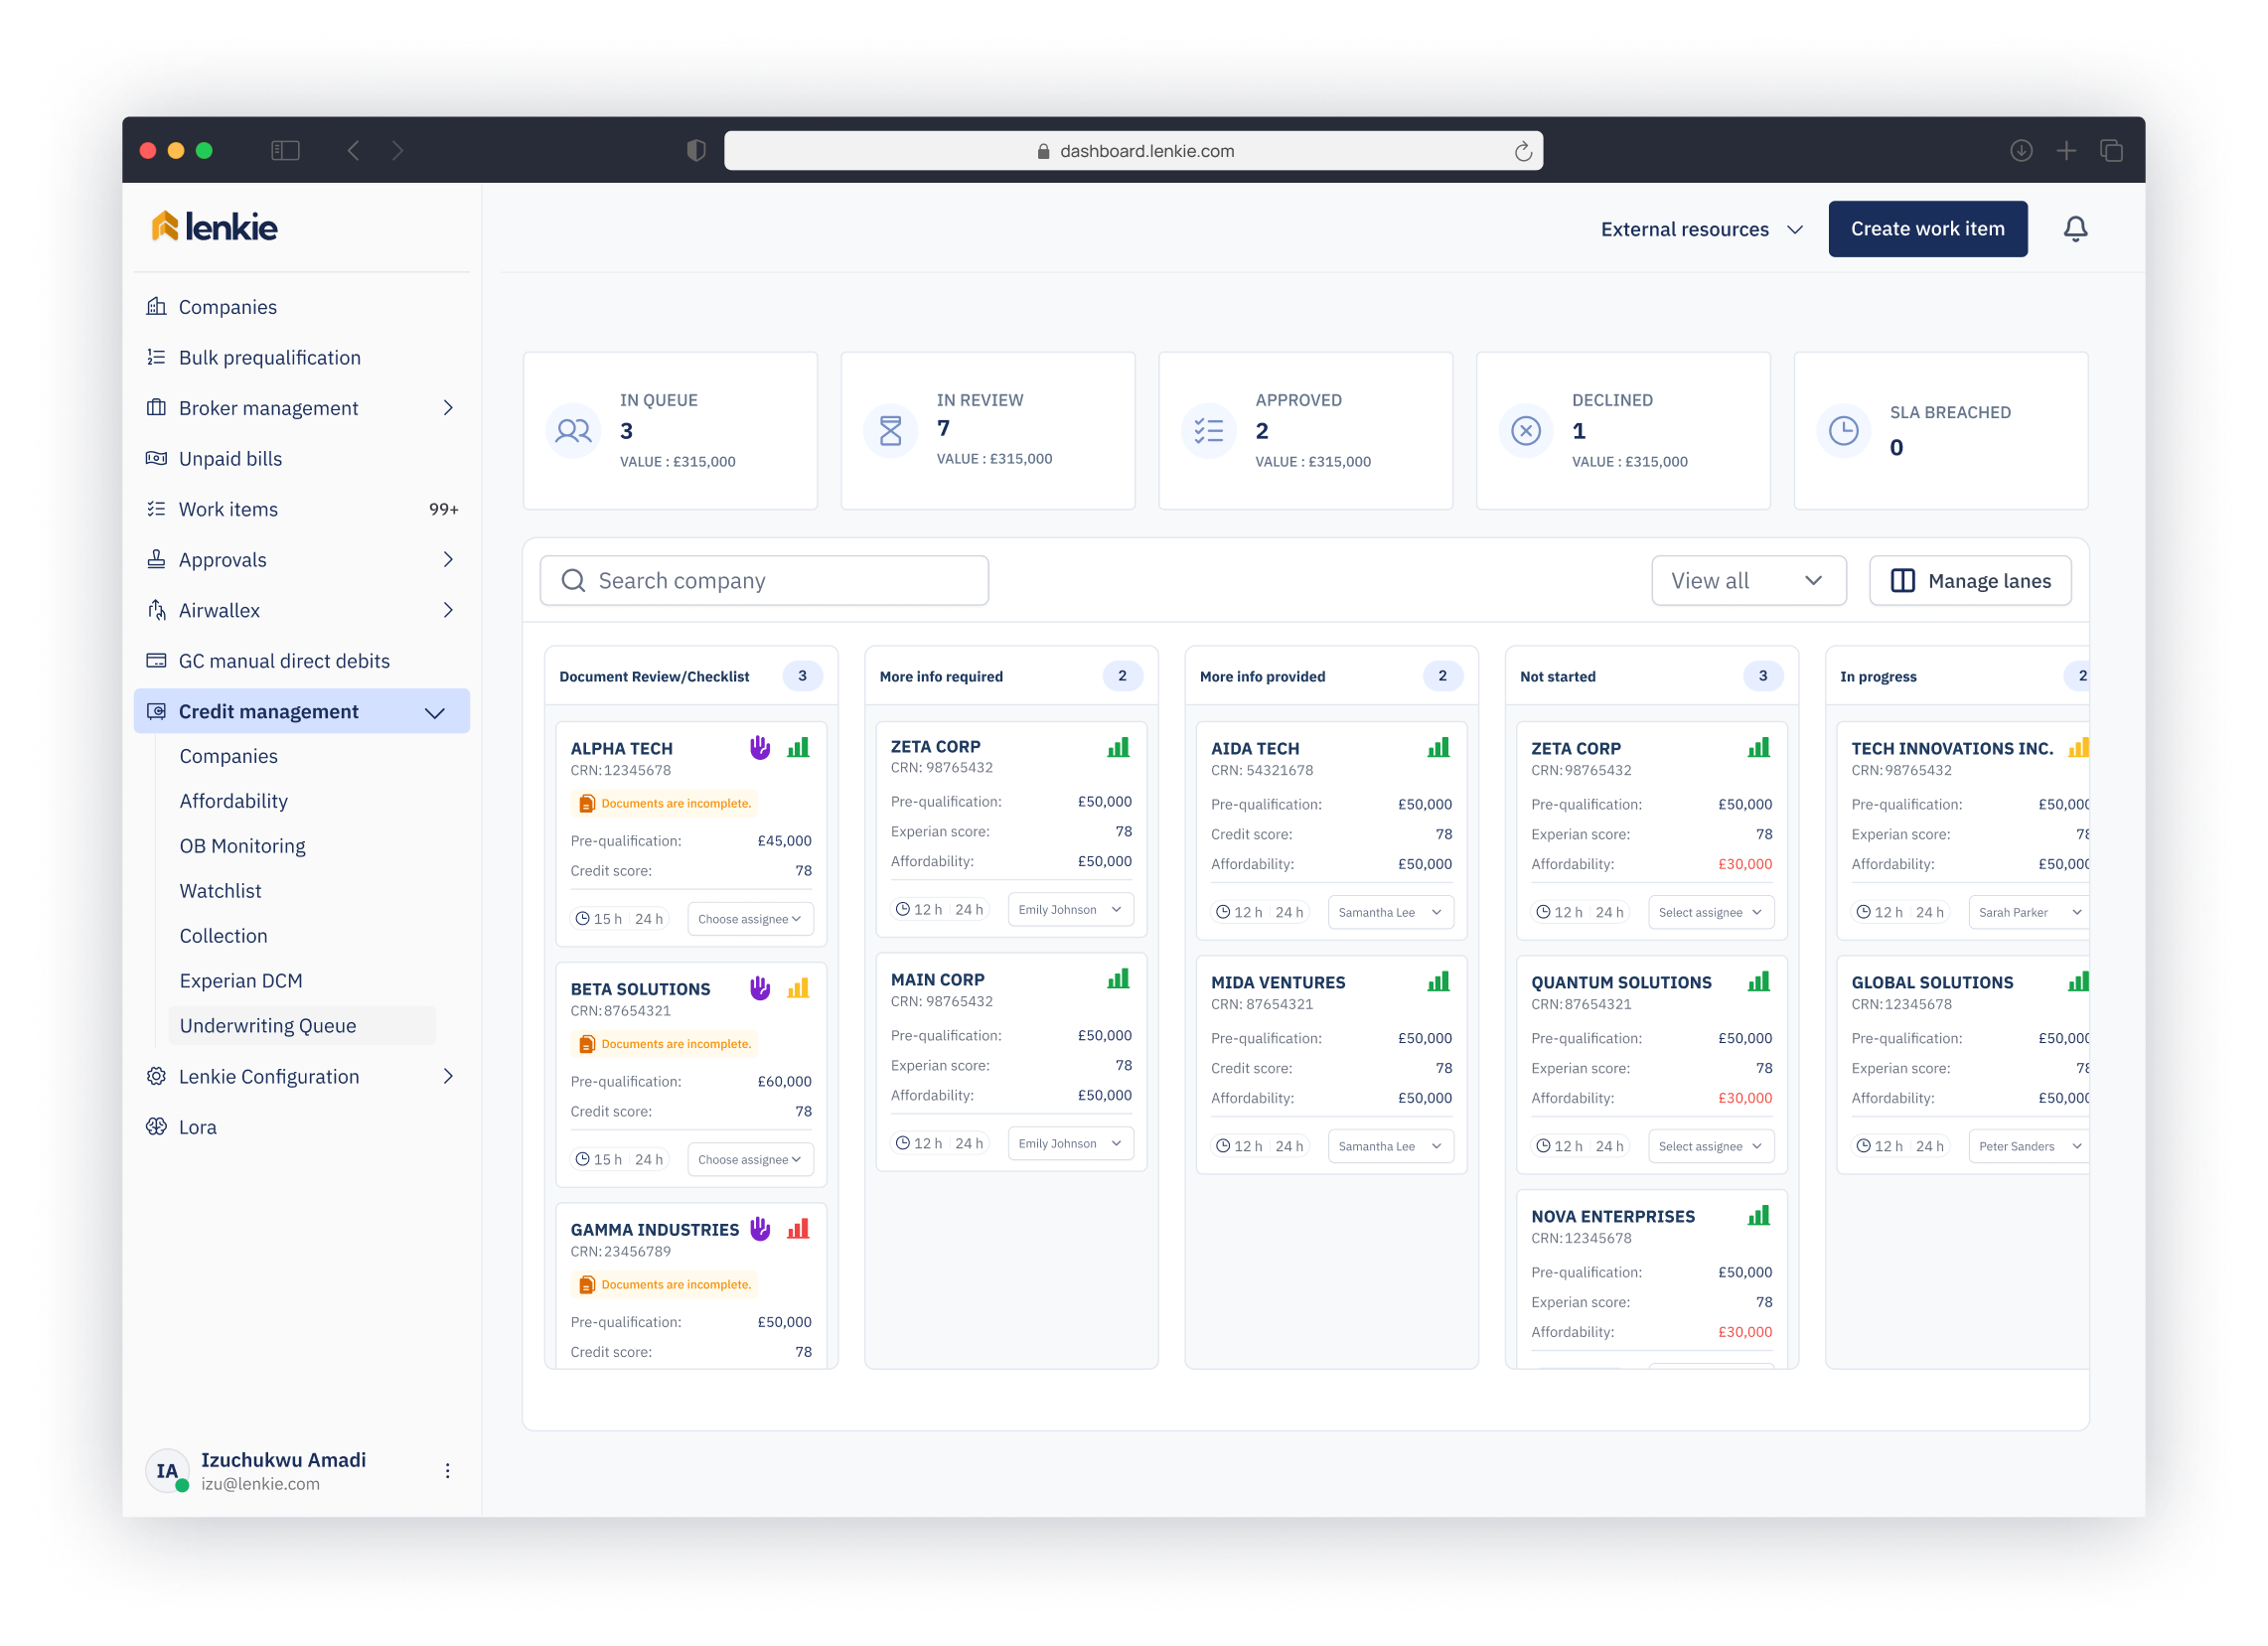
40 hours to 23: Redesigning credit underwritingfor faster, more defensible decisions

Lenkie Technologies · Product design · 2026

Next project in 10 seconds

Lenkie credit underwriting dashboard with review queues and application statuses